

Key Takeaways: Understanding Your Fm24 Pass Map Quick
- What it is: A visual showing who passed to who, how often, and general positions.
- Find it: In the match analysis section, usually under ‘Team’ or ‘Analysis’.
- Lines: Thicker lines mean more passes between those two players. Arrows show direction usually.
- Dots (Nodes): Represent average player positions during possession phases.
- Use it for: Spotting tactical issues (like isolated players), seeing if your formation is working as intended, identifying key passing links (or lack thereof).
- Helps Fix: Bad tactics, poor player instructions, understanding why attacks break down. Check it alongside the FM24 Data Hub Explanation.
What Even Is the Fm24 Pass Map? Breaking it Down Simple
Right then, the pass map in Football Manager 2024. What’s it all about, eh? Some folks look at it and just see a bunch of dots and lines, but it looks a bit like a kid’s drawing sometimes. But it’s one of the handiest tools you got for figuring out if your team is playing like you told ’em to.
Think of it like this: it’s a snapshot, a picture, of how your team moves the ball around when they have it. Forget fancy stats for a sec, this is pure visual feedback. Where do you find this thing? Usually, after a match, or even during if you pause, you gotta dig into the analysis bits.
Sometimes it’s under ‘Team Analysis’, sometimes just ‘Analysis’, depends on the skin maybe . Click around, you’ll find it. It shows your players as little dots, right? Their position on the map is kinda their average spot on the pitch when your team had the ball and was tryin’ to pass it about.
So, why’s it useful? Cos it tells you instantly who’s involved and who aint. See a dot way off on its own with hardly any lines comin’ from it? That player, mate, they’re bein’ ignored. Maybe they’re marked out the game, maybe your tactic just bypasses them completely.
The lines between the dots? That’s the passes. Simple. A thicker line means loads of passes happened between those two players. A skinny line? Not so much. Sometimes they have arrows, sometimes the thickness just implies the main direction, but you get the idea.
It shows the main highways your ball travels down. Is your star playmaker gettin’ the ball enough? Look at the lines goin’ to their dot. Is your striker isolated? Check how many passes reach them. It’s not just pretty, it’s diagnostic.
It helps you answer questions like “Why can’t we get the ball wide?” or “Are my two centre-backs just passing it between themselves all game?”. It’s a starting point for loads of tactical thinking, a real core part of the FM Tips and Tricks you need to master.

Forget just lookin’ at possession percentage; this tells you what you did with that possession. Big difference, innit?
Decoding the Lines and Dots: How Passes Show Up
Alright, let’s get a bit more specific with these lines and dots. So you’ve found the pass map, great. Now, what are you looking at? The dots, yeah, they’re your players. Their position is averaged out, so don’t expect ’em to be exactly where they stood every single second. It’s more like their centre of gravity when you had the ball.
If your defensive midfielder’s dot is way up near the halfway line, it tells you they were pushin’ up during your build-up play. If your winger’s dot is tucked right inside, maybe they’re cuttin’ in like you wanted, or maybe they’re just not stayin’ wide enough. Already, just the dots give you clues about your team shape in possession. It’s different to just looking at the formation screen before the match, this is what actually happened.
Now, the lines. They’re the important bit. Like we said, thickness equals frequency. Lots of passes between your two centre-backs? Thick line between ’em. Your number 10 barely got a sniff from the midfield? Thin, maybe even non-existent line there.
This is gold dust. You can instantly see the main passing combinations. Who relies on who? Is there a triangle of players dominating the ball? Or is it just one bloke hoofing it long?
Sometimes you’ll see arrows, showing the primary direction of the passes between two players. If the arrow from your centre-back to your defensive mid is way thicker than the one coming back, it shows that CB is initiating the move forward more often. It helps understand the flow.
You gotta combine this visual with other stuff, though. The pass map is powerful, but it’s part of a bigger picture available in the FM24 Data Hub Explanation. The Hub gives you numbers on pass completion, key passes, all that jazz. The map gives you the pattern.

Use ’em together. See a player with loads of passes on the map but a shocking completion rate in the Data Hub? Maybe they’re trying too many risky balls. See a player central to the map, loads of thick lines, and a high completion rate? That’s your hub, your metronome. Protect ’em! Identifying these key players, or the isolated ones, is step one to making smart changes.
Spotting Tactical Problems: When the Map Looks Wrong
So, when does a pass map scream “Houston, we have a problem”? What are the red flags? One of the most common ones, especially if you’re tryin’ to play through the middle, is the big ‘U’ shape. You know, the ball goes from centre-back to full-back, full-back to winger, winger maybe tries somethin’ or passes back, and it goes across to the other side via the defence.
The midfield dots? Barely connected. That’s midfield bypass, mate. Your engine room ain’t runnin’. Your tactic might say play through the middle, but the map shows you’re forced wide constantly. Why?
Maybe the opposition is packing the centre, maybe your midfielders’ FM Player Roles aren’t suitable (like having two Ball Winning Midfielders on Defend who just sit), or maybe their movement attribute is just pants.
Another classic? The lonely striker dot. Way upfield, thin little line connecting ’em to maybe one attacking midfielder, nothing else. They’re stranded. Starving up there. No wonder they only had 1 shot all game. The map shows you the supply line is broken.
Over-reliance is another one. See one massive, thick line from your centre-back to your right winger and basically nowhere else? You’re predictable. One-dimensional. Easy to defend against. A good pass map usually shows multiple connections, options, triangles. It shows the ball can move through different routes.
” I remember this one save I had, managing Blyth Spartans way down in the Top 8 FM24 Lower League Clubs. We were gettin’ battered every week, couldn’t figure out why our possession wasn’t leading to chances. Looked at the pass map. Oh dear. My two central midfielders were practically on top of each other on the map, just swapping short, sideways passes. My wingers were miles away, no connection. The striker was an island. The map looked like three separate teams on one pitch. It was clear the tactic, think it was a rigid 4-4-2 I downloaded, just wasn’t working with these players. The map forced me to rethink roles, instructions, everything. Started using a Mezzala to break forward more, pushed a winger into an Inside Forward role to link with the striker. The pass map started lookin’ healthier, more connections, and results picked up. It don’t lie, that map. “
Pass ‘Maps and Formations: Seeing Your Formation Styles

Click for more above ↑↑↑
How does your chosen formation actually look on the pass map? Does it match the theory?
Let’s take a popular one, the Best FM24 4-3-3 Tactics Download. What would you expect to see? Probably a solid triangle in midfield, right? The defensive midfielder linking the defence and the two more advanced midfielders.

You’d hope to see strong lines connecting the central midfielders to the wingers and the lone striker. The full-backs should ideally link with both the nearby centre-back and the winger ahead of them. If you see that, lovely jubbly, your 4-3-3 structure is working in possession.
But what if the map shows your wingers are isolated, only getting the ball from the full-backs? Or your striker is disconnected? Then your 4-3-3 ain’t functioning like a proper 4-3-3 in attack? The roles within the formation matter hugely here. A 4-3-3 with a Deep Lying Playmaker, two Mezzalas, and Inverted Wingers will have a very different pass map shape compared to one with a Ball Winning Midfielder, two Central Midfielders on Attack, and traditional Wingers.
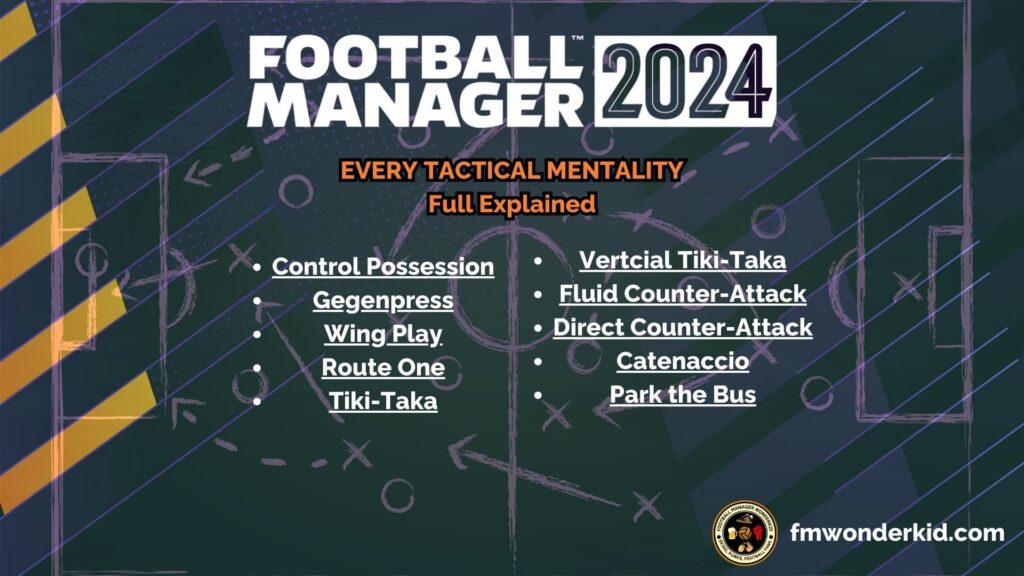
Now, compare different Formation Styles.
Think about a Control Possession 4-3-2-1 tactic. You’d expect lots of connections, particularly in the middle and final third. Short, intricate passing triangles. The map should look dense, lots of lines, players relatively close together to facilitate those short passes.

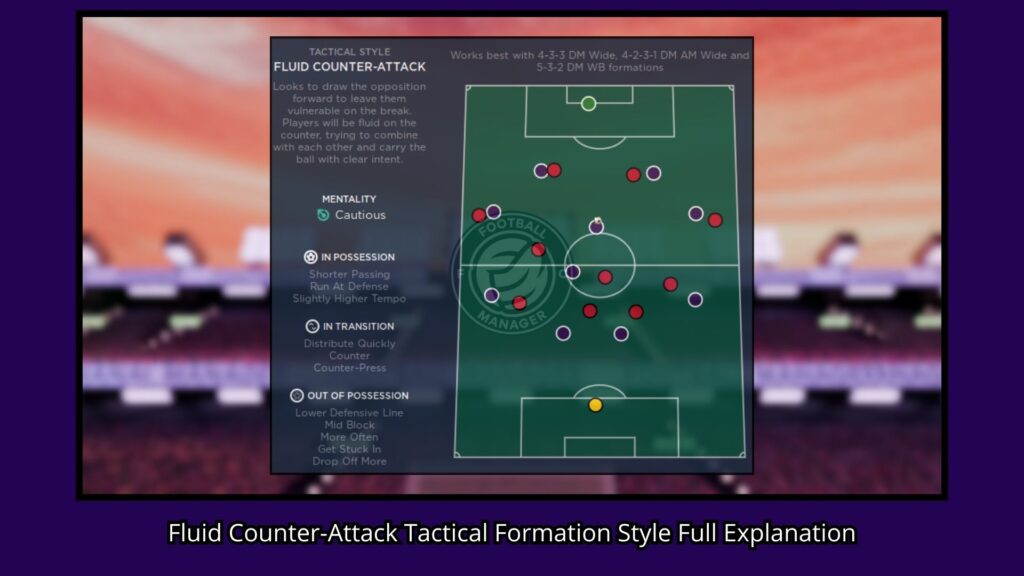
Contrast that with a Fluid Counter Attack style. Here, you might see fewer lines overall, but the ones you do see might be longer, more direct. Perhaps strong lines from the defence or deep midfield straight to the quick attackers or wingers. The map might look more stretched out, less clustered.
What about something really out there, like that experimental 3-2-4-1 No Full Backs Tactic? Blimey, that map could look weird. You’d expect the three centre-backs to be heavily involved, linking with the two holding midfielders. Then those four attacking midfielders?

They should be intricately linked, receiving passes from the deeper players and trying to feed the lone striker. If the map shows those four attackers are isolated from the defensive block, the tactic’s probably failing to connect defence and attack.
The pass map is brilliant for visually confirming if the weird and wonderful shapes you cook up are actually translating onto the pitch. It helps you understand the consequences of your tactical choices on ball circulation.
Using the Pass Map for Tactical Tweaks: Making Actual Changes
Okay, theory’s nice, but how do we use this map to make our team better? You’ve spotted the problem – maybe your striker’s lonely, or your midfield’s a black hole. What next?
This is where the map becomes your best mate for making targeted changes. Let’s say the map shows your expensive new striker ain’t getting the ball. The lines leading to his dot are thinner than my patience watchin’ England in a penalty shootout.
What can you do? First, look at his role and the roles of those supposed to be supplying him. Is he an Advanced Forward running beyond the defence, but your midfielders are all set to ‘Hold Position’? They’re not gonna see his runs, are they? Maybe change one midfielder to an Attacking Midfielder on Support or Attack, someone whose job it is to bridge that gap.
Or change the striker role to a Deep Lying Forward or False Nine, encourage him to drop deeper and link play himself – the map should then show his dot deeper and more connected. Maybe you need to change player instructions? Tell your playmakers to attempt more ‘Through Balls’. Or adjust team instructions – if the map shows everything going wide, maybe tick ‘Focus Play Through The Middle’?
What if the map shows your team is struggling to get the ball out from the back? Your defenders just passin’ it sideways? Maybe you need to adjust roles. Change a standard Centre-Back to a Ball Playing Defender to encourage more forward passes. Or, think about the players receiving the ball.
Are your midfielders marked out? Try changing their roles to something with more movement, like a Roaming Playmaker or Mezzala, to help them find space. Consider the FM 24 Inverted Full Back Wing Backs Wingers role – maybe having them drift inside helps create passing lanes from the defence into midfield that weren’t there before.
Changing the team’s overall FM24 Tactical Mentality can also shift the map. A more attacking mentality might push players higher, naturally shortening some passing distances or opening up others.
Don’t forget Opposition Instructions Tactics either. If the opposition is pressing your main playmaker intensely, maybe telling your team to play wider initially draws them out, creating space for your playmaker later.

The pass map won’t give you the answer, but it points you exactly where the problem lies, letting you experiment with specific, targeted solutions instead of just randomly changing everything. It makes your tweaking way more efficient.
Beyond the Basics: Advanced Pass Map Reading
Right, you’ve got the hang of the basic shapes and spotting obvious problems. How do we take it up a notch? Start lookin’ at trends, not just single matches.
One weird pass map could be a blip – maybe the opposition just had a perfect game plan against you that day. But if you check the pass map after five, six, ten games, and you consistently see your left winger isolated, or your midfield bypassed, then you know you’ve got a systemic issue with your tactic or personnel.
Consistency is key. Use the analysis tools to compare maps across matches. Does the pattern change when you play stronger teams versus weaker ones? Does it change away from home? This tells you how robust your system is. Maybe your possession game works fine against teams that sit back, but the pass map falls apart when you face a high press like Jurgen Klopp’s Gegenpressing in Football Manager.
Another level is lookin’ at individual player pass maps. Most analysis sections let you filter to see just the passes made by, or received by, a single player. This is brilliant. Is your Deep Lying Playmaker actually spraying the ball around like you want? Check their individual map.
Are they only making safe sideways passes? Or are they hitting those diagonals to the wingers? What about your striker? Who are they actually linking up with most? Maybe it’s not the CAM like you thought, maybe it’s the Mezzala making late runs.
Pass Maps and Player Development: Training for Better Passing
Can you actually train your players to make the pass map look better? Well, yes and no. You can’t directly train “make the pass map look like this”.
But you absolutely can train the attributes and traits that lead to better passing networks. If your pass map shows lots of short, sideways passing in midfield and an inability to break lines, what attributes might be lacking? Vision, Passing, Decisions, Technique, maybe even Composure under pressure.
So, focusing your FM24 Individual Training Focus on these areas for your key midfielders makes sense. If the map shows your defenders hoofing it long aimlessly, maybe work on their Passing and Composure. It’s about identifying the reason the map looks the way it does, and often that reason lies in player attributes.

Player Traits (FM24 Player Traits) are huge here too. See a midfielder central to the map but only playing safe passes? Maybe train them to ‘Try Killer Balls Often’ or ‘Dictate Tempo’.
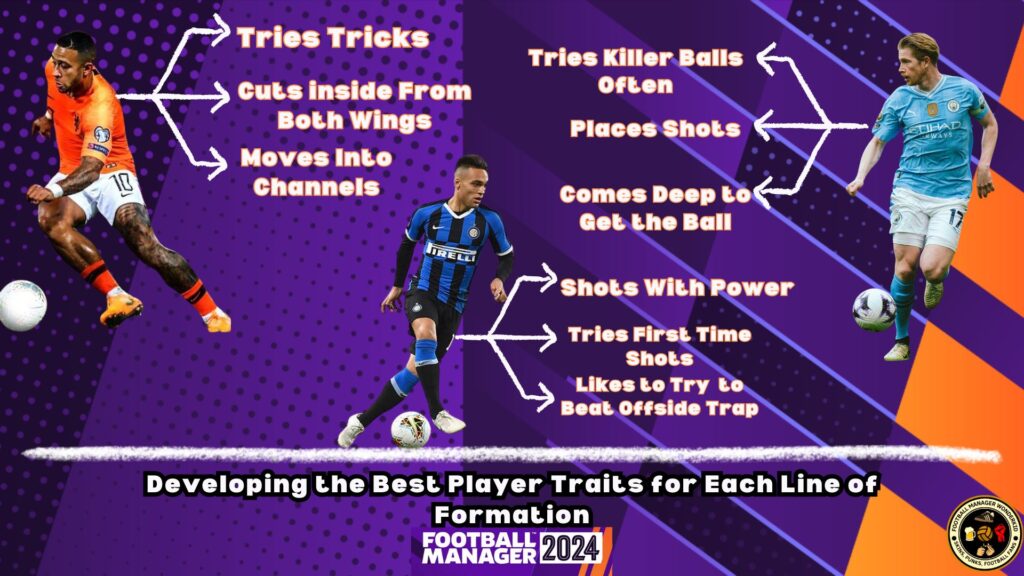
See a winger isolated on the map? Maybe train them to ‘Cut Inside With Ball’ to link up more centrally.
These traits directly influence player behaviour and, consequently, the pass map. You can use the pass map as evidence when deciding which traits to encourage or discourage. If a player constantly gives the ball away trying Hollywood passes (which might show up as attempted passes on some detailed maps or just low completion stats alongside the map), maybe try training them to ‘Play Simple Passes’.
It’s about aligning their tendencies with the role you need them to play in your system, the system you’re trying to build based on those passing connections. A good passing network, where players understand movement and options (reflected in a healthy pass map), also boosts team cohesion.
Players who link up well on the map often have better dynamics off it too, feeding into the whole Team Dynamics Player Personalities system. Players comfortable receiving the ball from certain teammates build partnerships.

So while you don’t train for the pass map, you train the things that create a good pass map. It’s a diagnostic tool that informs your player development decisions.
Frequently Asked Questions (FAQs)
Q: Where exactly do I find the pass map in FM24?
A: During or after a match, go to the ‘Analysis’ or ‘Stats’ tab. It’s usually under the ‘Team’ analysis section. The exact location might vary slightly depending on your chosen skin (FM24 Skins).
Q: What’s the difference between the pass map and the heat map?
A: The pass map shows passing links between players (who passed to who). The heat map shows where players spent the most time on the pitch, regardless of whether they had the ball or made a pass. They show different things but can be useful together.
Q: Can I see the opposition’s pass map?
A: Yes, absolutely. Analysing the opposition pass map is just as important for understanding how they play and how you might counter it using Opposition Instructions Tactics.
Q: Does a ‘good’ pass map guarantee a win?
A: No, definitely not. You can have beautiful passing patterns and still lose if you can’t finish chances or defend properly. But a ‘bad’ pass map often indicates underlying tactical problems that make winning much harder. It’s a tool for analysis, not a predictor of results on its own.
Q: My pass map looks okay, but we still play rubbish. Why?
A: The pass map mainly shows successful passes. Maybe your team completes passes but they’re too slow, too predictable, or don’t penetrate the defence. Look at other stats in the FM24 Data Hub Explanation like key passes, final third entries, and shot locations alongside the map. Maybe the type of passing is wrong, even if the connections look okay.
Q: How often should I check the pass map?
A: It’s useful to glance at after most matches, especially if the result or performance felt off. Do a deeper dive comparing several matches if you suspect a persistent tactical issue or after making significant tactical changes.
